Digital Pedagogies promote literacy in the use of technologies that leverage modalities besides simply text – not replacing traditional scholarship, but augmenting and extending its power. Through the provision of related software and equipment, as well as training in their use, the Research Commons provides the UNB community with opportunities to extend teaching, learning, and research to meet emerging contemporary realities.
Research Commons staff are here to assist with all or particlar stages or digital pedagogy projects as exemplified below:
Data Visualization
Visualizing data help communicate meaning and tell stories about quantifiable research findings. The Data Visualization Lab is a bookable spaces ideal for working with data visualizations, whether creating or presenting them. The Research Commons also provides access to ArcGIS and Tableau software and introductory training in their use.
Ping Pong Perspectives in the Research Commons is a fun community surveying tool used to poll students, staff, and faculty on issues of collective relevance. As people participate, results change in dynamic, colourful ways. Data is tabulated and presented using Tableau Public. This "living laboratory" is available for student and faculty projects.
Research Commons visualizations on Tableau Public -->
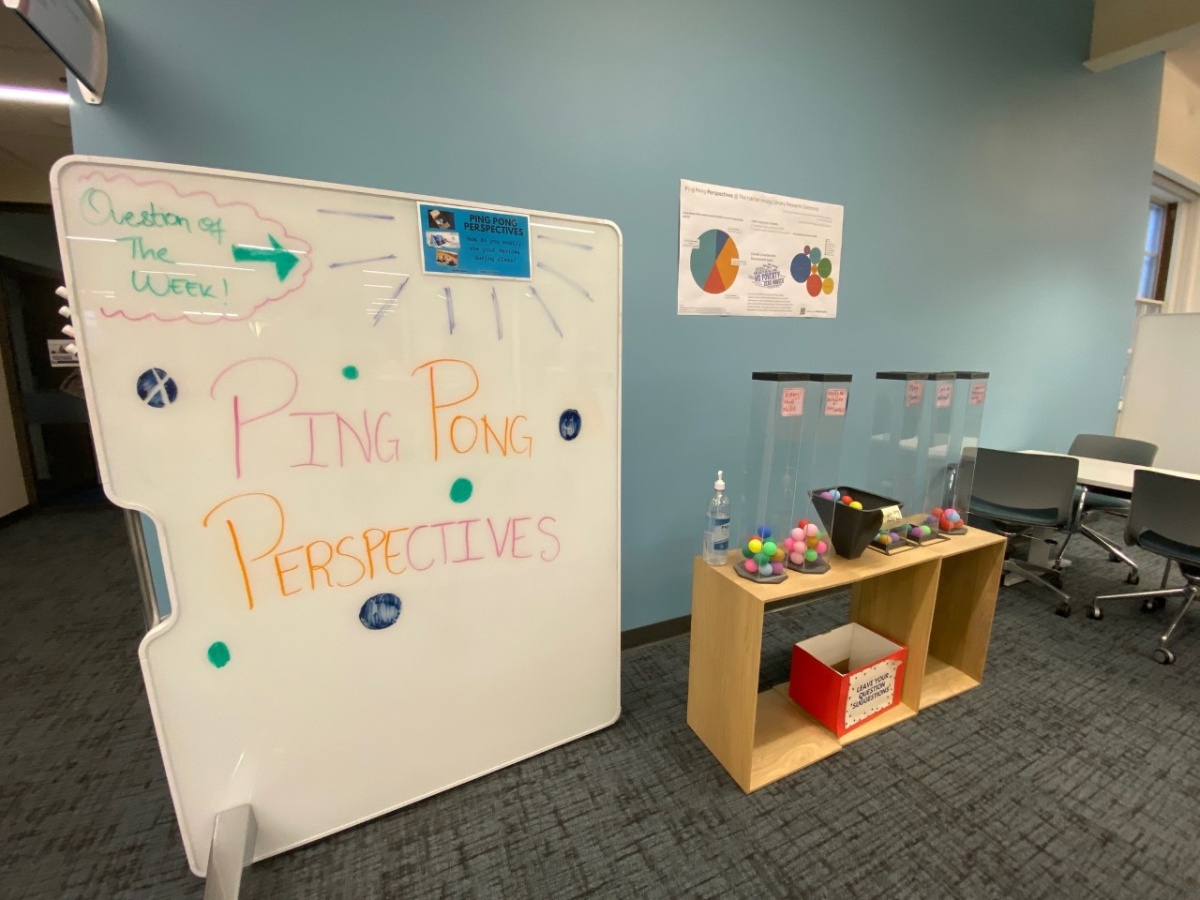
Ping Pong Perspectives station
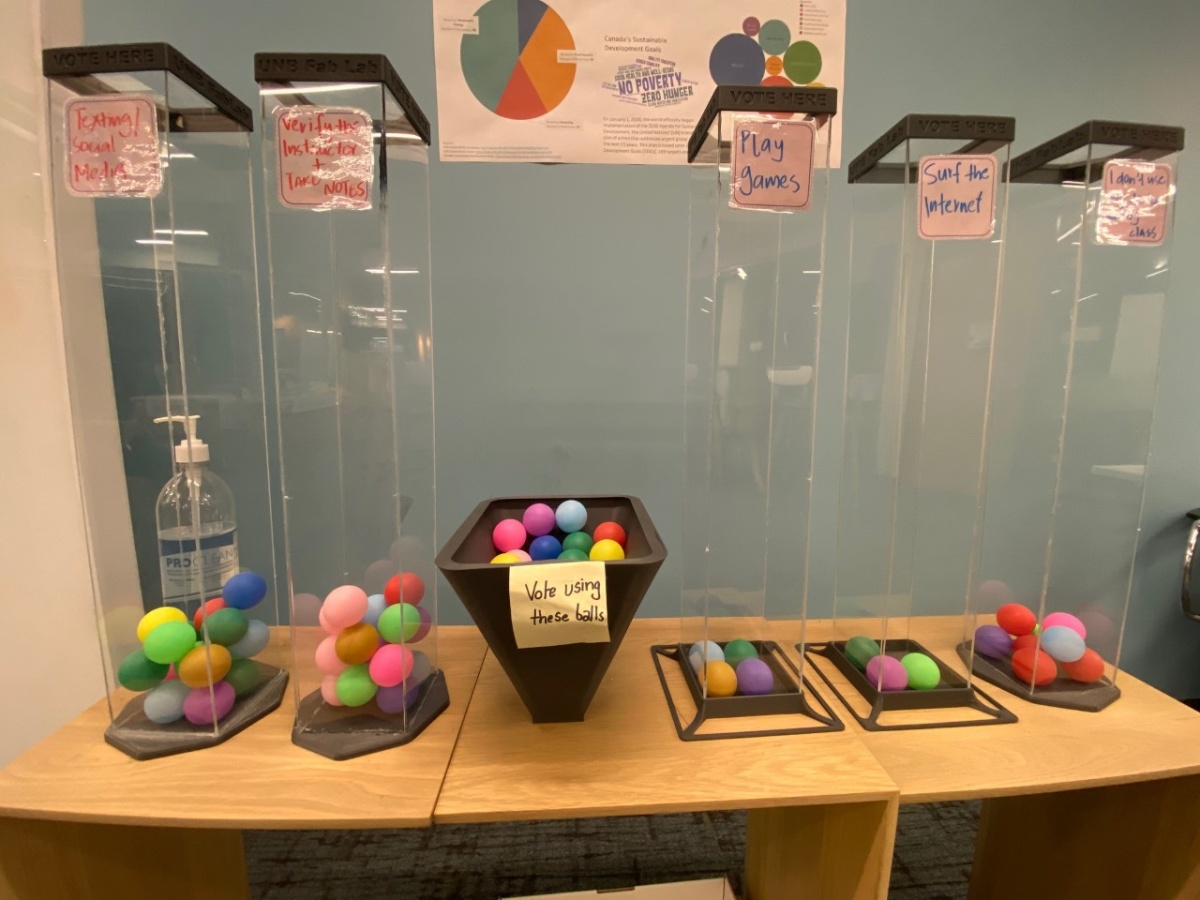
The station in action
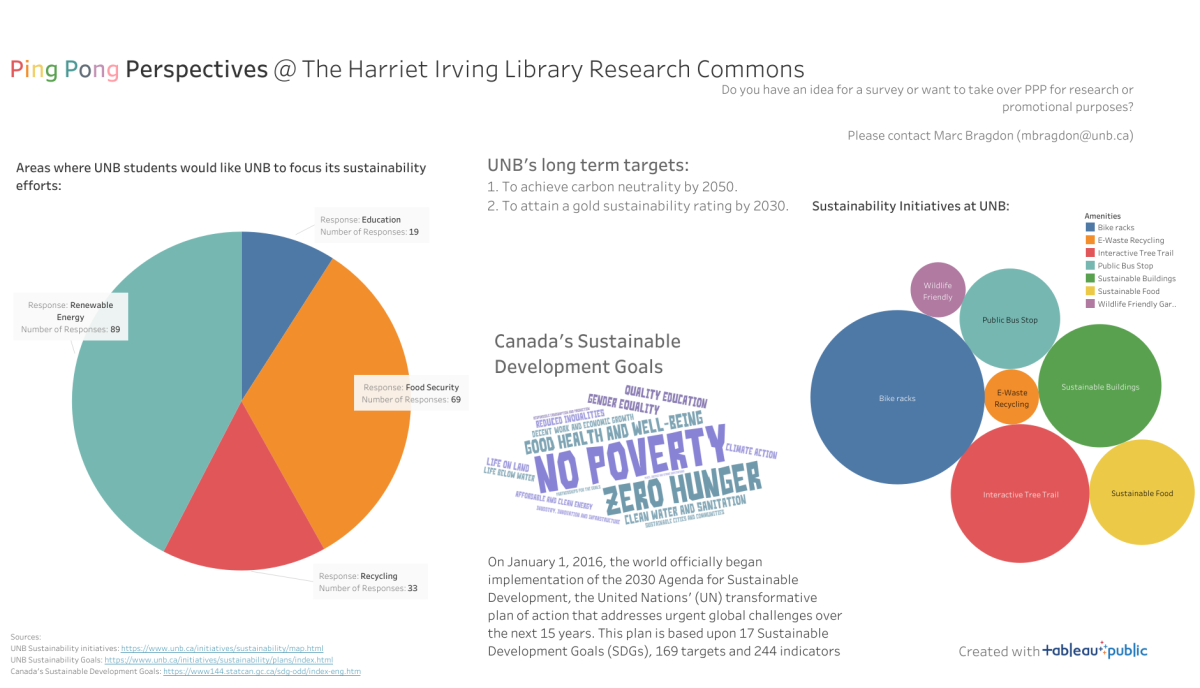
Sample Tableau Visualization
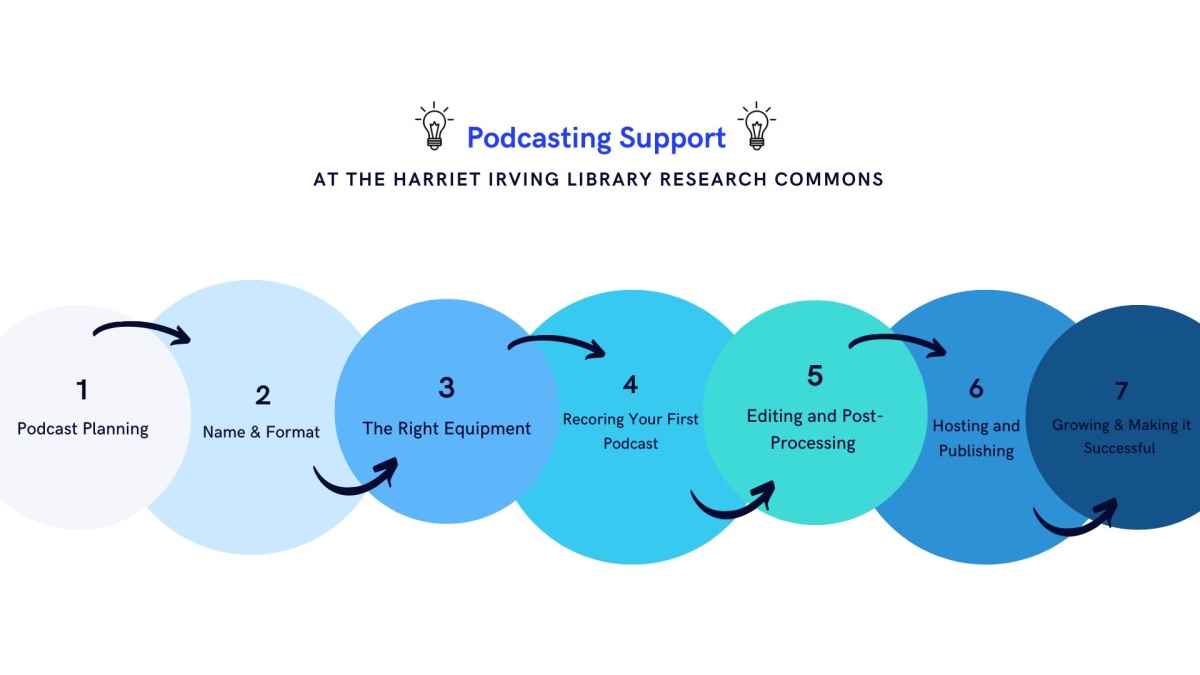
Podcasting
A popular means of explaining, promoting and, in some case, conducting research. We provide access to an Audio Studio and loan out smartphone-based microphones for field recording to students or groups we are actively advising. The advising and assisting can be to do with planning, writing, recording, editing, sound design, and promotion - any or all of these.
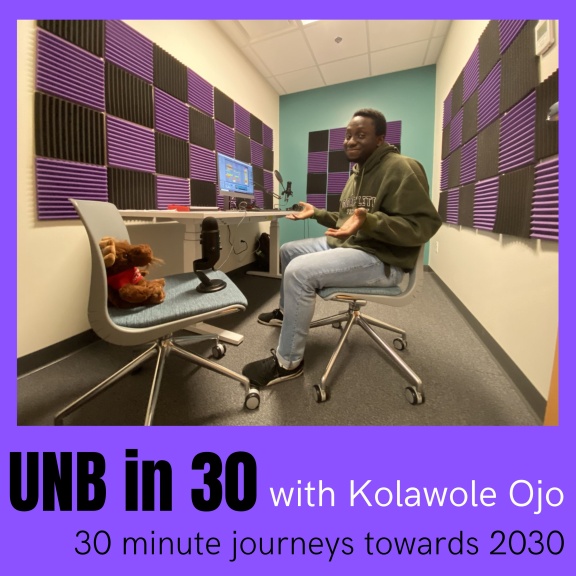
Catch the Research Commons podcast UNB in 30: conversations of 30 minutes or less testifying to our journey together towards 2030:
Listen on Spotify
Listen on Anchor
Storymaps
ArcGIS StoryMaps is a story authoring web-based application that allows you to share your maps in the context of narrative text and other multimedia content. You can use ArcGIS StoryMaps to do the following:
- Author stories with the story builder. Stories can include maps, narrative text, lists, images, videos, embedded items, and other media.
- Publish and share your stories. Published stories each have their own URL, and you can use these URLs to share your stories within your organization, to specific groups, or with everyone.
- Create and publish collections. Collections can include stories and ArcGIS web apps bundled together for easy sharing and presenting.
Examples from the Research Commons:
- Sofia Paleolog: Grandmother of Ivan the Terrible (February 23, 2022)
- History and Culture of Ukraine: The heart of Europe (March 16, 2022)
- Liliuokalani, Queen of Hawaii: Livia, Hawaii's first and only Queen (March 16, 2022)
- The Women Who Made The Augustan Age: Livia, Octavia, Julia and Agrippina (March 23, 2022)
- ᎾᏅᏰᎯ Nanyehi: The warrior woman who fought for her people (September 7, 2022)
- Elizabeth II: Britain's longest reigning monarch (September 8, 2022)
- Truth and Reconciliation Day: Holding Canada accountable (September 29, 2022)
- The Women of UNB: Women who made history at our school (October 5, 2022)
- The Witches of Salem: Just a bunch of hocus pocus? (October 7, 2022)
Video creation and editing
The Research Commons provides access to the Ligthboard Studio for video creation and live streaming. We can advise on best practices for creating videos, from planning and capture through to post-production and promotion. We can also loan out smartphone-based microphones, lights, tripods/rigs, lenses/filters, and a teleprompter to students or groups we are actively advising. There is a 4 PC Adobe Creative Cloud Cluster for post-production, sound design, animation, and more. Note too that there are 3 Mac workstations in the first floor Learning Commons, each with Adobe Creative Cloud installed.
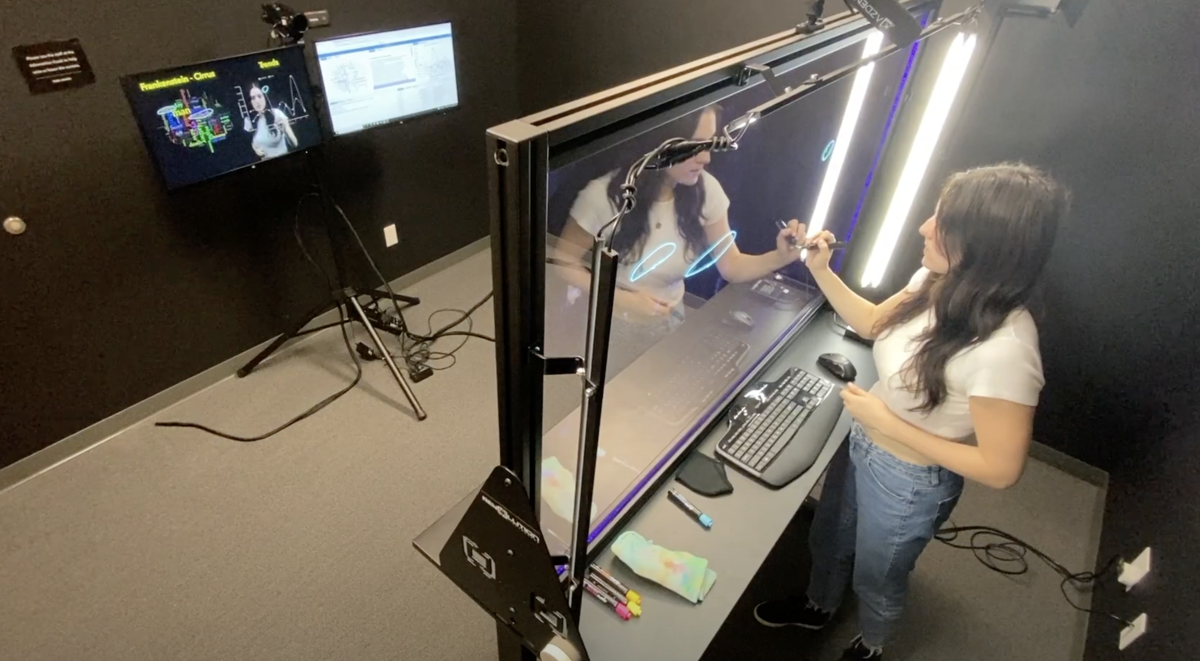
The Lightboard Studio