Ingesting Your Data
Scenario Background
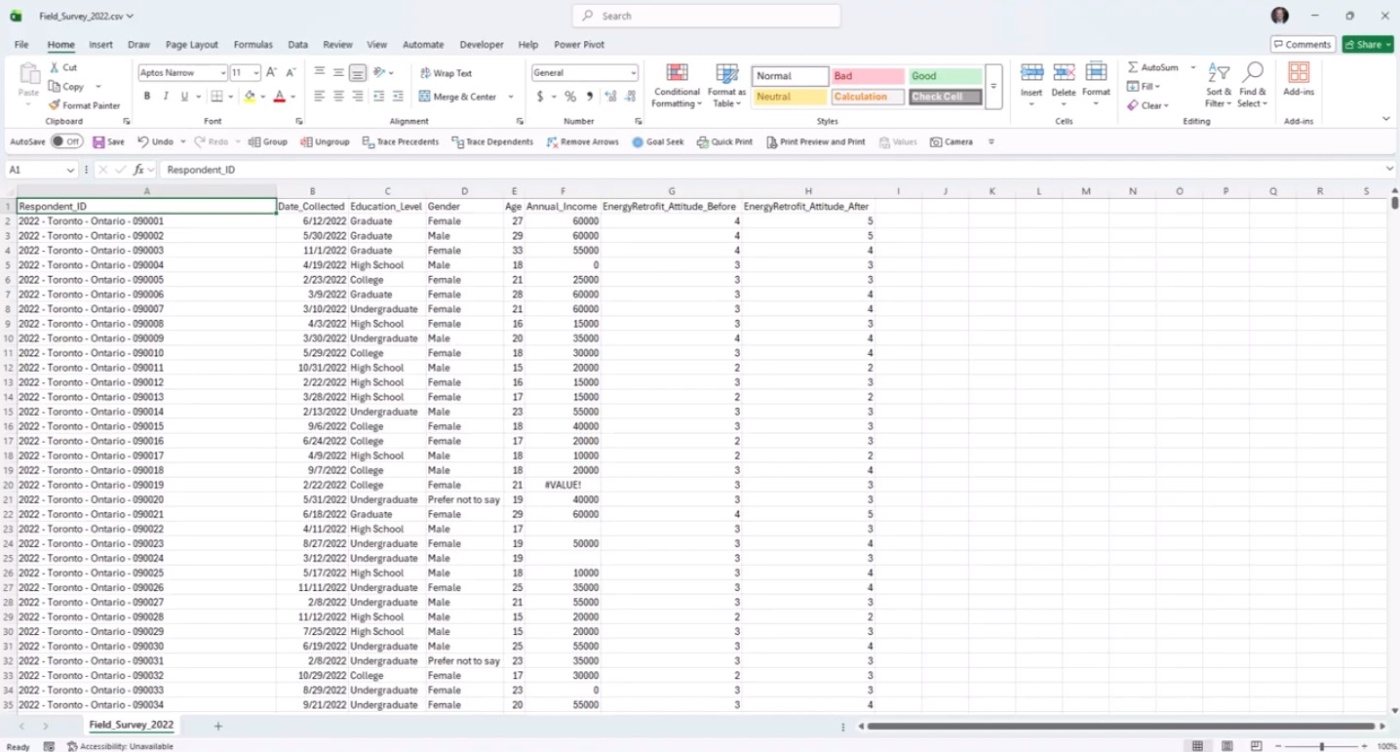
Imagine your research supervisor gives you this CSV file of survey responses which you have opened in Excel. This survey was taken in 2022 and it polls students (from high school, college and university) in 13 Canadian cities in 5 different provinces about their thoughts on Energy Retrofitting.
Some of the cities have already engaged in a energy retrofit promotional campaign and others have not. Our supervisor is interested in finding out if living in cities with active promotional campaigns had any effect on their attitudes towards it.
The survey respondents are questioned on their attitudes before a brief discussion about retrofitting and after it. We see that each row is one respondent and that there are 10,000 respondents in this file. The fields or columns are Collection Date, Education Level, Gender, Age, Annual income and a before and after energy Retrofit Attitude score which ranges from 1-5 where 1 is low, 3 neutral and 5 is high.
Note the clean data structure of this dataset:
- Headers are at the top row followed by rows/records
- No empty rows or columns
- Each column/field has only one data type
- No totals, subtotals or other non-record information in the rows.
When working with a datasets, or constructing your own datasets, it is important to keep these points in mind especially when you want to incorporate your data in Power Query or other database-type software. Excel allows you to be flexible when structuring your data which can be a feature but when you want to process data systematically, you need to be mindful of proper data structure.
Your research supervisor also hands you a data dictionary. A data dictionary gives insight and context to the data like explaining what each column or field means. It can sometimes also contain more information on the data like the context for which it was collected, how it was collected, who did the data collection and/or analysis as well as other features like what the breakdown of responses was and what the response codes mean. It is best practice to always start by inspecting the data dictionary first to get a good handle on the data you will be working with.
Task: Your research supervisor asks you to clean this up and to have a tidy version of this data table on their desk in by the end of the day. Specifically, they want to see retrofit attitude data for female university students between 20 and 25 years of age. Now you could do a decent job of this by using Excel functions but we are dealing with a rather large data set and some of the functions could get a little complicated. Plus, your supervisor wants you to document any change so that they can understand how you’ve come up with the final product. So given that, you think that using Power Query could be ideal to make some quick transformations.
Scenario Activity
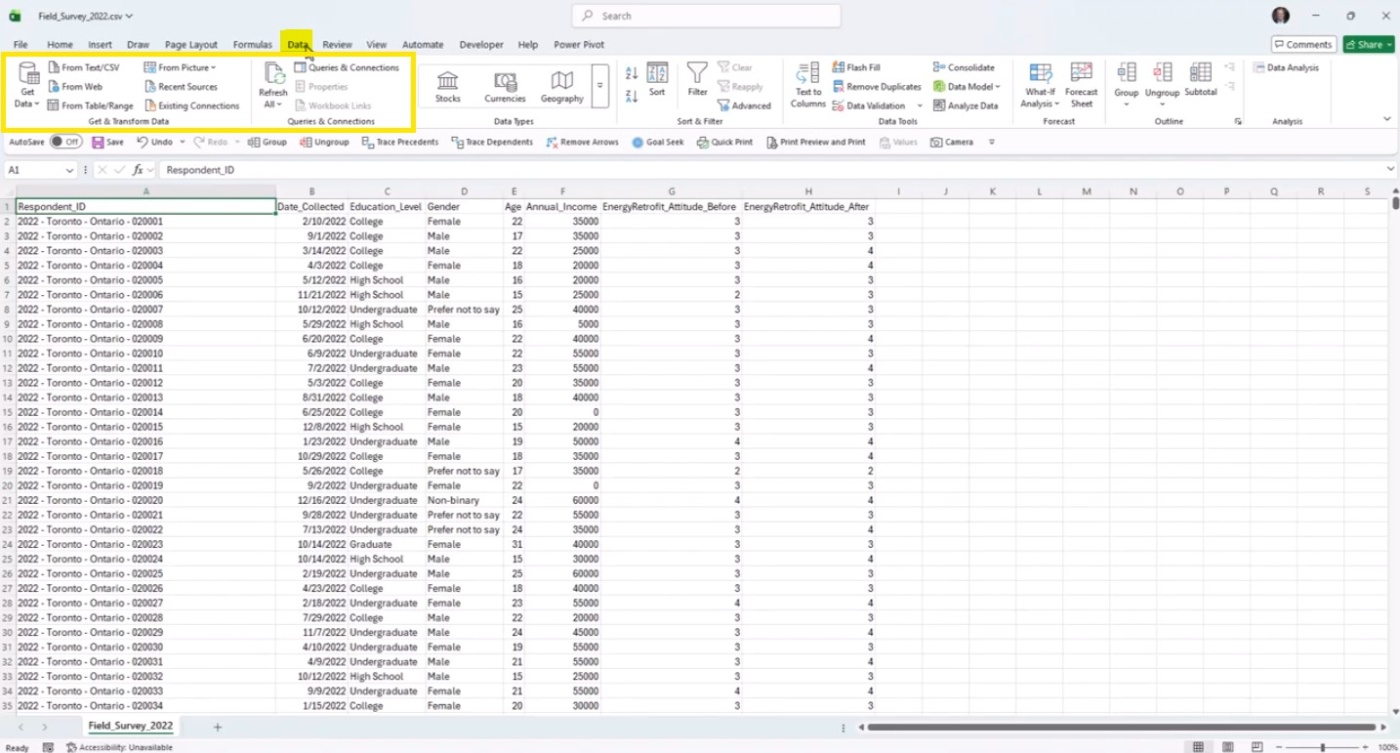
Ok, but how do we get this data in Power Query? To do so, we’ll go to the Power Query section of Excel which is in the Data ribbon.
Next to the Get Data button, we have some common options of how to get our data but in this case, since all the data we want is right here in this spreadsheet, we can choose the Table/Range option. Although we have not converted our data into an official Excel table, as soon as we use this Power Query option, Excel converts our range into a table which it creatively calls Table1. This will bring the data in the Power Query editor, which we saw in the previous tab's illustration.
Now that our data is in the Power Query editor, let’s do a few transformations. This is a big dataset and maybe we are only interested in a sliver of the data to answer one of our research questions. Let’s say that we are only interested in answering our supervisor’s question: analysing respondents who were Female undergraduate and graduate students between 20 and 25 years of age who lived in NB.
Let’s select New Brunswick in the Respondent ID column. We do this by clicking on the dropdown arrow of the column and selecting Text Filters and selecting "Contains" from the dropdown menu. We then type in New Brunswick.
Now only entries with New Brunswick will be selected bringing our table records down from 10,000 rows to 277 rows.
Lets select undergraduate and graduate from educational level.
This brings the dataset down to 148 rows.
We can do the same method to select Female as the gender which brings the dataset down to 67. And we bring the dataset down to 48 by using the same technique on the age field and selecting ages between 20 and 25 inclusively.
This dataset now looks much more manageable and targeted. Let’s try to clean it up a little more.
- We don’t need the Date Collected or Annual Income columns for our analysis so we can just delete them by clicking on the column header and pressing the delete button.
- We also would like to see the Gender and Age columns followed by the Educational Level so let’s move that. We can do that by clicking on the column header and using our mouse to bring it to the desired location in the dataset.
- Finally, we can change the text of the column headers by double clicking on the title and renaming them. The text for the Attitude Survey is a bit wordy so let’s truncate it a little bit by removing the "EnergyRetrofit" text.
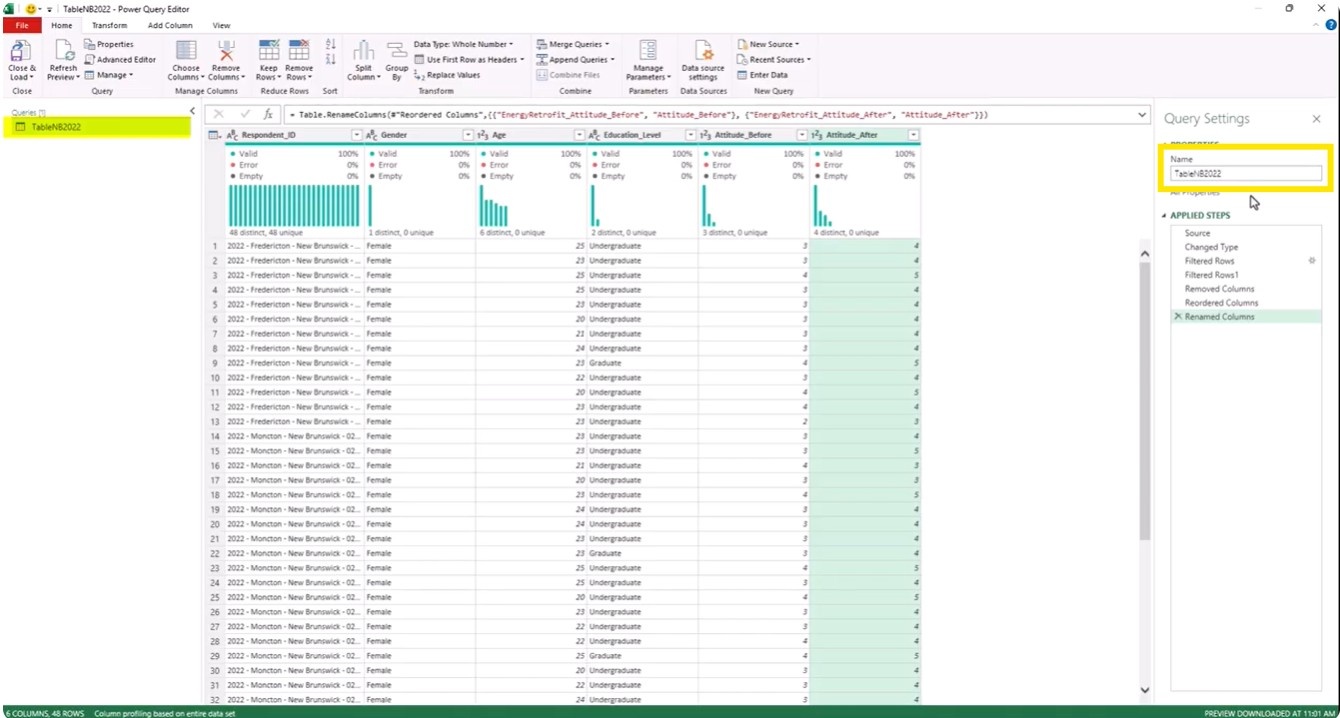
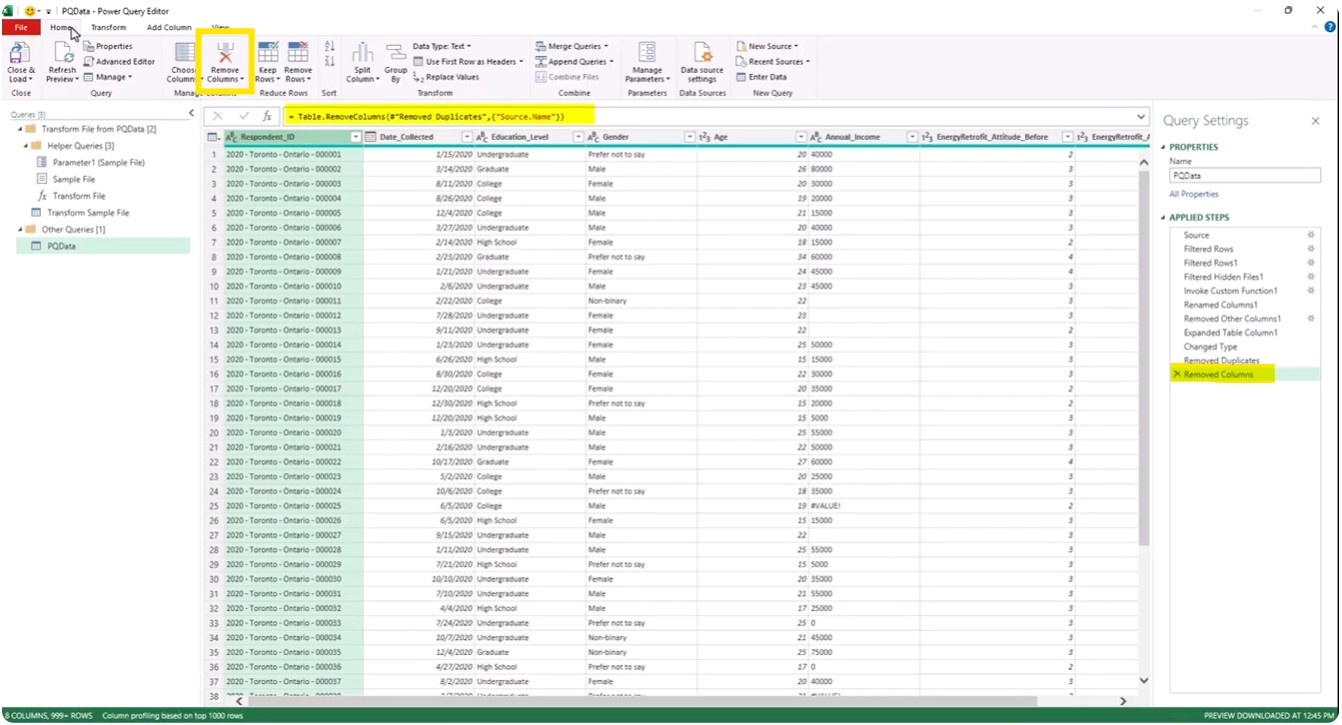
We can see that there are many transformations that have occurred and that all the steps are documented on the Applied Steps pane at the right of the screen. This is perfect because our Research Supervisor can inspect our steps and even recreate our method very easily.
We can change the name of the steps and add notes to give us more insights on what it is doing by right clicking on it and selecting Properties. We can move steps up or down but we need to be careful when we do that because sometimes things can break because they are not properly linked anymore. We can also always delete a step.
When we see a gear icon next to a step, we can click on that to see the mechanism behind the step and make changes if necessary. Also, the M code for each step is being displayed in the formula bar and if we know what we are doing, we can make changes to the code as well.
Let’s change the name of our query to TableNB2022 so that we know what this is doing.
Note that the query name also changes in the query pane. This looks pretty good for now.
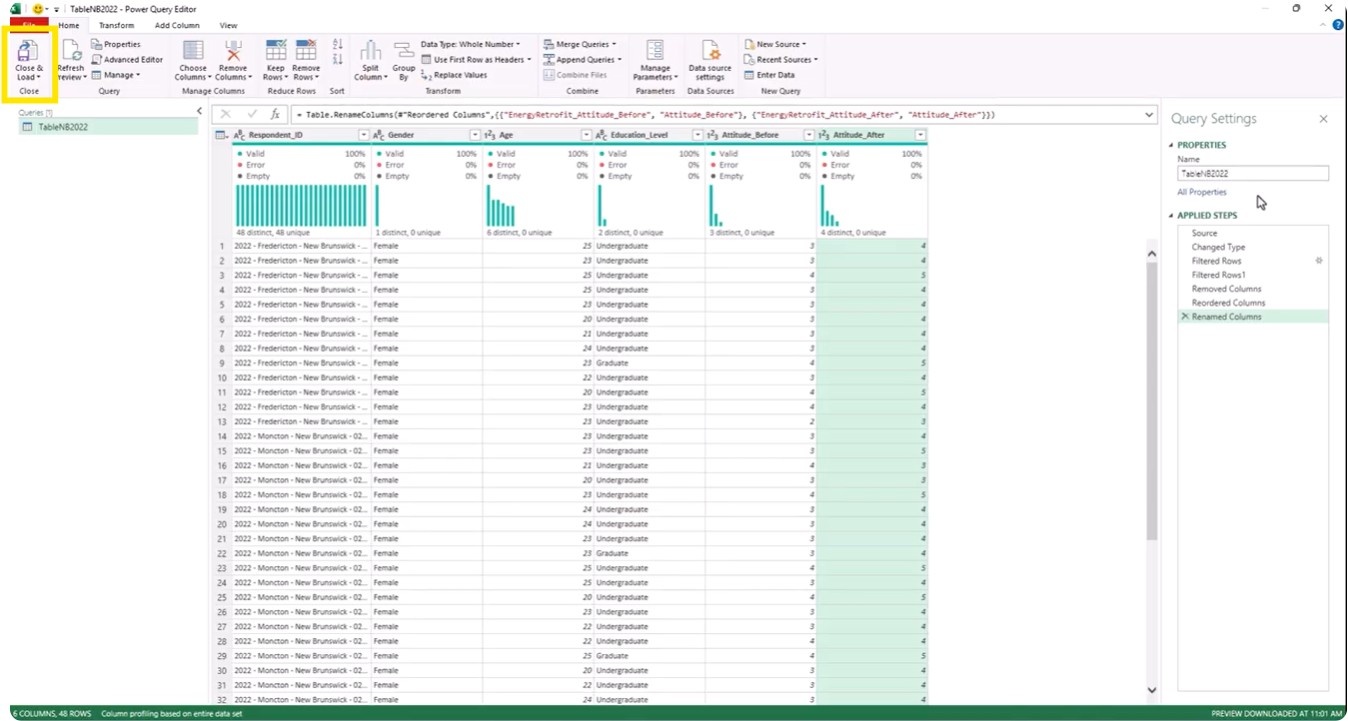
Once we are done and satisfied with our changes, we can press the Close and Load button and Power Query will load our transformed data as a data table in a new sheet of Excel.
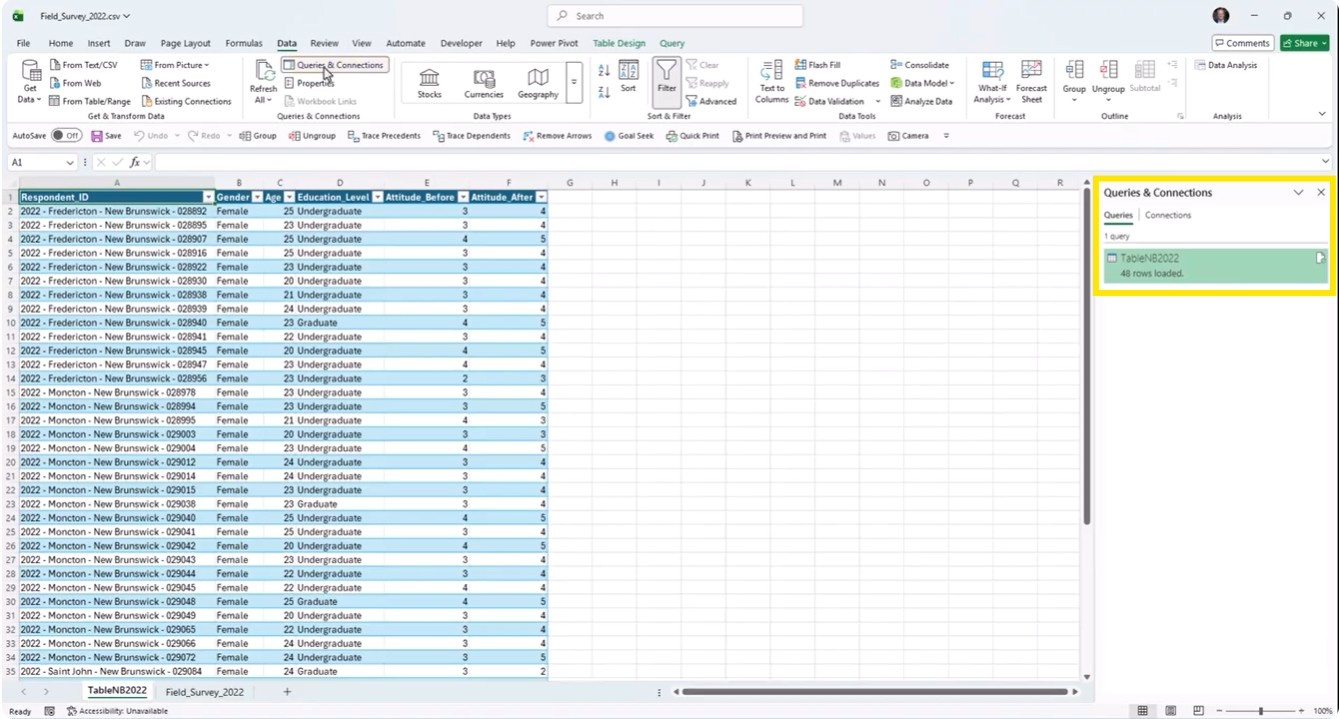
When that happens, we see a Queries and Connections pane on the right-hand side of the screen.
If we close that pane and want to get it back, we can always access it by clicking on the Queries and Connections button in the Data ribbon. If we wanted to access this query again, we simply need to double-click on it and you’re right back in the Power Query editor.
Post-Scenario Analysis
A word of warning here. We are doing all this in a CSV file. CSVs are great because they are flattened data files that can get ingested by a lot of different data tools. Unfortunately, they are not super functional so they can only have one sheet for example. They also don’t support Power Query. So if we were to save this, we would lose our Power Query work and only one sheet would be saved. The way to get around that would be to save this document as an Excel file or .xlsx file and that would retain all the integrity of this document. Another way to do this is to access the CSV data remotely from another Excel file and that’s something we will learn how to do in the next section.
Alright, just a quick aside, one of the great side benefits of using Power Query is that the original data is never altered. It is good practice to keep the original data intact. In this case, we are not touching the original data which is unaltered in the other sheet. We are just using the data from that sheet in Power Query, transforming that data and then generating our own analysis based off of it.
But, if we were to change something in the source file, like a header name or the Table name, it would compromise the Power Query code. This is because the M language stores references as literal strings so changing these references breaks the code. So remember that if you change something, a reference, the position of a step, etc. it may impact the code downstream and you will need to fix this in order for Power Query to work properly again.